Advanced analytics improve process optimization
Success stories show how advanced analytics software is used to create insights and improve process efficiency. See three use case examples.
Learning Objectives
- Understand how gathering analytics data used to be a manual and time-intensive process before the Industrial Internet of Things (IIoT) streamlined the process.
- Explore how advanced analytics software enables organizations to connect to many types of data sources and improve process efficiency.
- Review three use cases of how engineers used analytics to improve operations and predictive maintenance.
Analyzing process data for optimization used to require manually sifting through and staging data from on-premises process historians and other sources using limited spreadsheet tools and add-ins. This process was difficult to set up and took up large chunks of skilled engineers’ and analysts’ time to query each source system, extract the necessary data and aggregate and align data across often-mismatched timestamps.
The rigid architecture of on-premises data sources makes it challenging to pursue Industry 4.0 projects because it is difficult to use the insights generated through data analysis beyond plant walls. This prevents cross-site benchmarking and implementation of uniform analytics strategies across an organization due to a lack of interconnectivity among data sources, and the inability to centrally manage all data from one interface.
In recent years, Industry 4.0 technologies have yielded tremendous improvements in the democratization of data analytics, saving engineers and analysts time spent wrangling data and empowering them to focus on process optimization. This is possible due to the growing use of advanced cloud-based analytics solutions, which simplify managing large volumes of process data, and analyzing data to generate insights.
Leveraging the cloud for process data analytics
Process industries are realizing they must transition their data management and associated analytics capabilities to maintain profitability, while also addressing sustainability concerns. One of the first steps organizations can take in this process is leveraging the cloud as a resource.
Despite the misconception data must be centralized or migrated to the cloud before valuable insights can be generated using advanced analytics, the reality is organizations can use on-premises and cloud-based data in parallel. By selecting a cloud-native data analytics application, an enterprise can ease into the migration by connecting to its data wherever it resides, enabling extraction of operational insights at every step of its long-term data management strategy.
Cloud-based analytics applications enable process manufacturers to reduce new software implementation time so they can deliver products to end users faster, while improving quality, and reducing infrastructure and maintenance costs. Using point-and-click interfaces for descriptive, diagnostic, predictive, and prescriptive analytics, these applications fulfill the needs of many user personas, including engineers, operators, and data scientists.
Additionally, IIoT implementations can directly access the vast computing power and scalability of the cloud when implementing Industry 4.0 projects, such as predictive maintenance programs and digital twins. When paired with advanced analytics applications, these efforts empower process manufacturing organizations to optimize production procedures, increasing throughput and flexibility.
These and other types of self-service applications provide subject matter experts (SMEs) with direct data interaction, while requiring less time and manual data wrangling effort to resolve problems that engineers couldn’t before.
Use case 1: Predictive maintenance at scale
By leveraging advanced analytics, process manufacturers have shifted from monitoring and reacting to issues as they arise to using data and context to proactively inform decision-making.
In one case, engineers at a chemical company were looking to improve their control valve maintenance strategy. They decided to evaluate whether or not a predictive maintenance program could reduce costs incurred from frequent and unplanned feed valve servicing. The hope was for a model-based predictive maintenance strategy that could be deployed across all the company’s control valve assets, which are critical to product quality.
With advanced analytics, the engineers collaborated with data scientists to create a model comparing the theoretical and operational valve-flow coefficient of one control valve. Conditions in the algorithm were used to identify periods of valve degradation in addition to past failure events. By reviewing historical data, the SMEs determined the model would supply sufficient notification time to deploy maintenance resources so repairs could be made prior to failure.
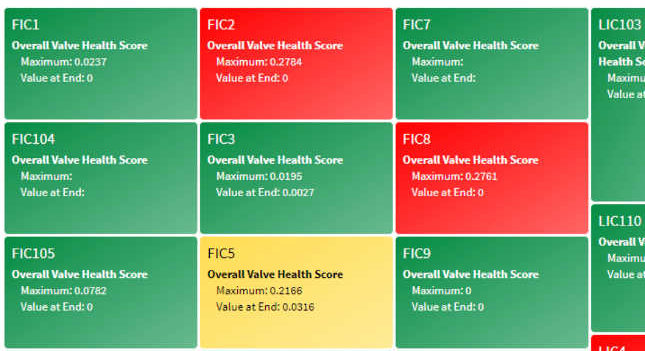
Next, the company’s data scientists scaled up the model, building an asset hierarchy of all valves in service. Collaborating with reliability engineers and process SMEs, they classified each asset by variables and model assumptions, both required so users could sort by type and leverage roll-up views—such as treemaps—across assets (Figure 1).
Because it is cloud-based, this advanced analytics application housed more than enough computational power to scale the model from one control valve to thousands of valves throughout the organization.

Figure 1: A treemap displays a chemical company’s critical control valve health scores within a production unit. Courtesy: Seeq
Use case 2: Catalyst end-of-run prediction
Over time, the fixed bed catalyst used in hydrodesulfurization units degrades, impacting product quality until it is replaced. While the weighted average bed temperature (WABT) is often a key metric used as a proxy to indicate catalyst bed health, creating an accurate WABT model for optimized production is difficult because it can fluctuate due to process variables, including composition and flow rate. For this reason, data scientists must apply cleansing techniques to the calculated WABT model prior to plotting to create a suitable data set for the regression algorithm (Figure 2).

Figure 2: The chart compares a full data set with a recent sample set of weighted average bed temperature predictions, both indicating maintenance will be required in the coming months. Courtesy: Seeq
Engineers at an oil and gas company needed to determine if the degradation of the catalyst bed on a hydrodesulfurization unit had accelerated in recent months. The team calculated and extrapolated multiple regression models to predict the required maintenance date.
After analysis, it became clear the degradation rate had accelerated in recent months and the original time-based catalyst change out would not come soon enough if they continued operating at current rates. This analysis justified an early catalyst change, alleviating months of constrained rate operation, and saving more than $5 million.
Use case 3: Run length optimization
Process effects, including catalyst degradation and fouling, can constrain production rates throughout the course of a manufacturing run. This is often the case for polymer production processes.
As portions of produced material begin to coat the insides of pipes and vessels, defouling is required so accumulation buildups do not impact flow or increase the pressure delta to where damage is caused to upstream equipment. Most buildup can be reversed via online or offline procedures that apply heat to the coated equipment, melting off the foulant layer.
A large polyethylene producer was experiencing production rate degradation due to fouling, and was investigating a way to optimize its defouling strategy to increase production and fulfill customer orders sooner.
A team of SMEs created a regression model using the degradation rate to forecast when production targets would be met if no action were taken. Next, they compared this to an alternative model incorporating defouling procedures, and then calculated the number of defouling cycles required to minimize the total time to produce a given order size. Once this was identified, engineers created a golden profile for the optimal number of future cycles between defouling procedures (Figure 3).
By deploying this online model in the advanced analytics application environment, plant personnel could trace the forecast during actual production to indicate when to execute the next defouling procedure. This strategy enabled a continuously booked production unit to fulfill orders at an average of 11% sooner over the course of the following year, empowering it to gain significant market share.

Figure 3: This chart depicts the optimization problem (top) and its graphical solution (bottom) in Seeq analytic software. Courtesy: Seeq
Easing data pain with analytics
Growing weary of wrangling disparate data from different sources and creating insights using traditional tools, an increasing number of process manufacturers are turning to advanced analytics software. Advanced analytic software frees up time to focus on process optimization, troubleshooting and predictive maintenance. Now plant personnel can produce analyses that tell stories, which can give them the confidence to make well-informed operational decisions.
Advanced analytics software enables organizations to connect to many types of data sources and transform information into insights for predictive maintenance and improved process efficiency. Such improvements empower increased production and improved quality, safety and sustainability, which can lead to long-term profitability.
Allison Buenemann is an industry principal at Seeq Corp, and a 2021 Engineering Leader Under 40. Edited by Chris Vavra, web content manager, Control Engineering, CFE Media and Technology, cvavra@cfemedia.com.
MORE ANSWERS
Keywords: analytics, process optimization
ONLINE
CONSIDER THIS
How can advanced analytics improve your facility?
Original content can be found at Control Engineering.
Do you have experience and expertise with the topics mentioned in this content? You should consider contributing to our CFE Media editorial team and getting the recognition you and your company deserve. Click here to start this process.