Predict process events with contextual data insights
Maintenance teams see predicted machine failures
When people talk about data analytics in manufacturing and process industries, they usually refer to obtaining insights from raw data to make data-driven decisions.
As a member of a team that helps companies gain tangible benefits from raw process data, I have learned that reaching the top level — an augmented factory, where the organization is using data to prescribe process behavior — comes with unique challenges. Still, companies often are relieved to learn that reaching an augmented level is an achievable goal.
Early production knowledge typically includes the status, performance, and health of facilities, production lines, and machines. As companies achieve data-driven insights, they learn about production time, downtime and defects. From this, they also can predict when unwanted downtime events may interfere with production.
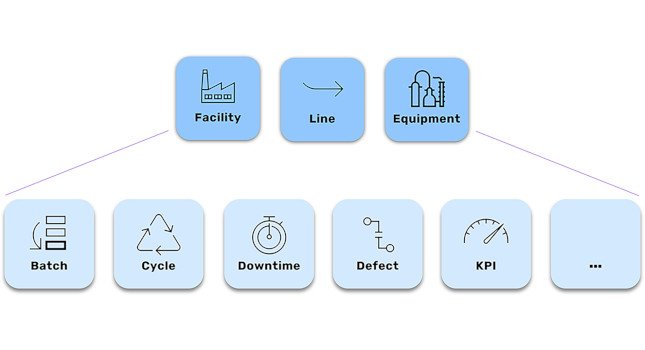
Plants usually express these “Contextual Process Events,” as shown in Figure 1, in units, such as batches, phases, cycles and campaigns. Downtime events also include planned or unplanned maintenance, emergency stops, changeovers, defects and quality inspections.

Figure 1: Contextual process events in a production environment—such as at a facility, along a production line, or at a particular machine—directly affect batches, cycle time, downtime, anomaly detection, key performance indicators and more. Courtesy: Trendminer.
Process data insights improve cycle times, overall equipment efficiency (OEE), product quality and asset health. Engineers can use them to correct an anomaly quickly, and over time, learn when the problem might happen again.
The right path
Our team believes quantifying options is the best approach. We encourage our customers to test their assumptions continuously with four types of data analytics:
•Descriptive analytics (identifying what happened),
•Diagnostic analytics (identifying why it happened),
•Predictive analytics (predicting when something will happen) and
•Prescriptive analytics (knowing what to do to change a predicted outcome).
The four types of analytics are used to generate decisions and actions in what we call the “Augmented Analytics Cycle.” Companies in the most advanced stage of their data analytics journey continuously test these four types of data analytics to make data-driven decisions across their organization.
The augmented analytics cycle shows that we cannot see end-to-end use cases using only descriptive, diagnostic, predictive or prescriptive analytics. For example, to reach predictive maintenance, companies must gather descriptive and diagnostic data and make insights from it to identify what happened and why. Once we have access to predictive insights, we can use that information to generate a model for building an end-to-end predictive solution.
In the following example, we worked with a company that had problems with its heat exchanger reaching the correct temperature. Working through the model, its engineers applied the first three analytics types to derive a prescriptive maintenance schedule. The result? A consistent temperature in its heat exchanger.
The following demonstrates how the company used each type of analytics to accomplish its goal:
Descriptive analytics: The heat exchanger cannot reach the set output temperatures anymore.
Diagnostic analytics: Fouling causes a performance drop, but process experts learned using the data analytics solution that cleaning solves the problem.
Predictive analytics: The solution knows when fouling will occur again based on the discovered operating parameters.
Prescriptive analytics: When the heat exchanger does not meet setpoint temperatures, the solution tells process experts it’s time to clean.
How do we know that we have the right predictive maintenance schedule? Sometimes, we do not. That is why we must apply all four types of analytics at the augmented level. If fouling no longer causes a problem in the heat exchanger, we must gather new insights, starting at the descriptive level and work through the steps to close the cycle again.
Predictions into prescriptions
The term “prescriptive” can mean optimizing decision-making, forecasting production, or simply alerting someone that they need to go check equipment. All definitions rely on the same requirement: The ability to know enough about the process anomaly to determine when it might happen again.
Typically, we use the same formula for all production processes. To get to the prescriptive level, companies must gain insights through data exploration and hypothesis testing, build a machine learning (ML) model or algorithm that can predict an outcome with an early indicator, and use that indicator to make smart decisions.
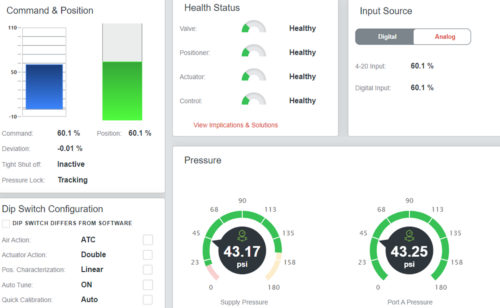
As an example, we worked with a company in the oil & gas industry to build a solution that informed maintenance teams what tasks were priorities and avoid predicted machine failures. Figure 2 shows pump pressure anomalies. The company could see by the dark orange indicators where the pressure did not match the ideal PSI. In the case of Figure 2, the pumps would need immediate attention. We also were able to integrate the solution with the company’s ERP (Enterprise Resource Planning) system to create maintenance work orders automatically.

Figure 2: Self-service data analytics solutions enable process experts to visualize anomalies over time, as shown in this dashboard view of pump pressure. The regions in orange signify times when the pressure fell outside the ideal PSI range. This let process experts know that these pumps required immediate attention. Courtesy: Trendminer.
For a company in the food & beverage industry, we helped process experts decide how to optimize raw materials. The solution sent prescriptive recommendation notifications to operators regarding use and dose in its extractors. The company had raw materials from different external suppliers that had varying quality characteristics. Which supplier it chose could affect the outcome of the production run. The benefits of knowing which to choose were increased yield, quality improvements, and better use of the raw materials.
More than just process data
In the preceding examples, we looked at how we could use prescriptive analytics to influence and optimize the production process. But we asked process experts during a visit to a German plant in 2021: What is your biggest challenge? As it turned out, their biggest challenge didn’t have anything to with analytics.
Their biggest challenge was Knowledge Retention. The plant manager explained that more than half of his workforce planned to retire within the next 10 years.
“What that means for us is that every person that joins the company will now have to onboard to become experienced and 100% knowledgeable about the production process in two years, and become fully independent from their experienced counterpart,” he said. “This used to take 10 years.”
Furthermore, Millennials and Generation Zs switch jobs more often than previous generations. Gaining insights from the data and creating visual dashboards, alerts, or predictive models was key.
Even though the company’s biggest challenge was not interpreting the data itself, the opportunity was a perfect example of how we could apply prescriptive analytics. We distilled insights and knowledge from experienced colleagues and stored it in a knowledge base. The insights and expertise led to the development of models for notifications and alerts, which are available now to employees who are new to the company.
Helping a company improve its ability to onboard new employees was as important to us as keeping its processes functioning correctly. By applying prescriptive analytics, we accomplished both.
Do you have experience and expertise with the topics mentioned in this content? You should consider contributing to our CFE Media editorial team and getting the recognition you and your company deserve. Click here to start this process.